Get a monitor and contributor to air quality data in your city.

| # | city | US AQI |
|---|---|---|
| 1 | Canby | 54 |
| 2 | Prairie City | 42 |
| 3 | Bunker Hill | 32 |
| 4 | Cedar Mill | 30 |
| 5 | Joseph | 25 |
| 6 | Millersburg | 25 |
| 7 | Marion County | 23 |
| 8 | Detroit | 21 |
| 9 | Sublimity | 21 |
| 10 | Bandon | 20 |
(local time)
SEE WORLD AQI RANKINGAIR QUALITY DATA CONTRIBUTORS
745 Contributors


See all
| # | city | US AQI |
|---|---|---|
| 1 | Lane | 0 |
| 2 | Alsea | 2 |
| 3 | Corvallis | 3 |
| 4 | Damascus | 3 |
| 5 | Monmouth | 3 |
| 6 | Oregon City | 3 |
| 7 | Rose Lodge | 3 |
| 8 | Stayton | 3 |
| 9 | Sunriver | 3 |
| 10 | Veneta | 3 |
(local time)
SEE WORLD AQI RANKING


News
The latest air quality news and resources.
Oregon’s air quality is generally considered safe to breathe. In 2019, Oregon cities averaged an annual air quality index (AQI) level of 38, passing the US Environmental Protection Agency (EPA) standard of less than 50. This was an improvement from the previous two years, 2017 and 2018, which both averaged an AQI of 43. Currently, nearly all Oregonians live in areas that meet US EPA air quality standards. Aloha, Oregon was the only exception in 2019.
Of the six criteria pollutants monitored by the EPA in real-time, fine particle pollution, known as PM2.5, is of primary concern in the state. PM2.5 is airborne particulate matter measuring 2.5 micrometers or smaller. As PM2.5 is categorized by its size rather than its chemical composition, PM2.5 commonly includes a range of dust, dirt, ash, soot, chemicals, metals and vapors.
Its small size allows some particles to circumvent the body's defenses and enter the circulatory system, causing a wide range of short- and long-term health effects. Exposure to PM2.5 has been definitively linked to health effects such as heart and lung disease, respiratory infection, lung damage, cancer, and even early death.
The World Health Organization (WHO) recommends that annual exposure to deadly PM2.5 not exceed 10 μg/m3, a slightly more stringent threshold than the US EPA’s 12 μg/m3. In 2019, 95 percent of Oregon cities met this standard (an improvement over the national average of 79 percent), up from 65 percent of cities in 2018 and 52 percent of cities in 2017.
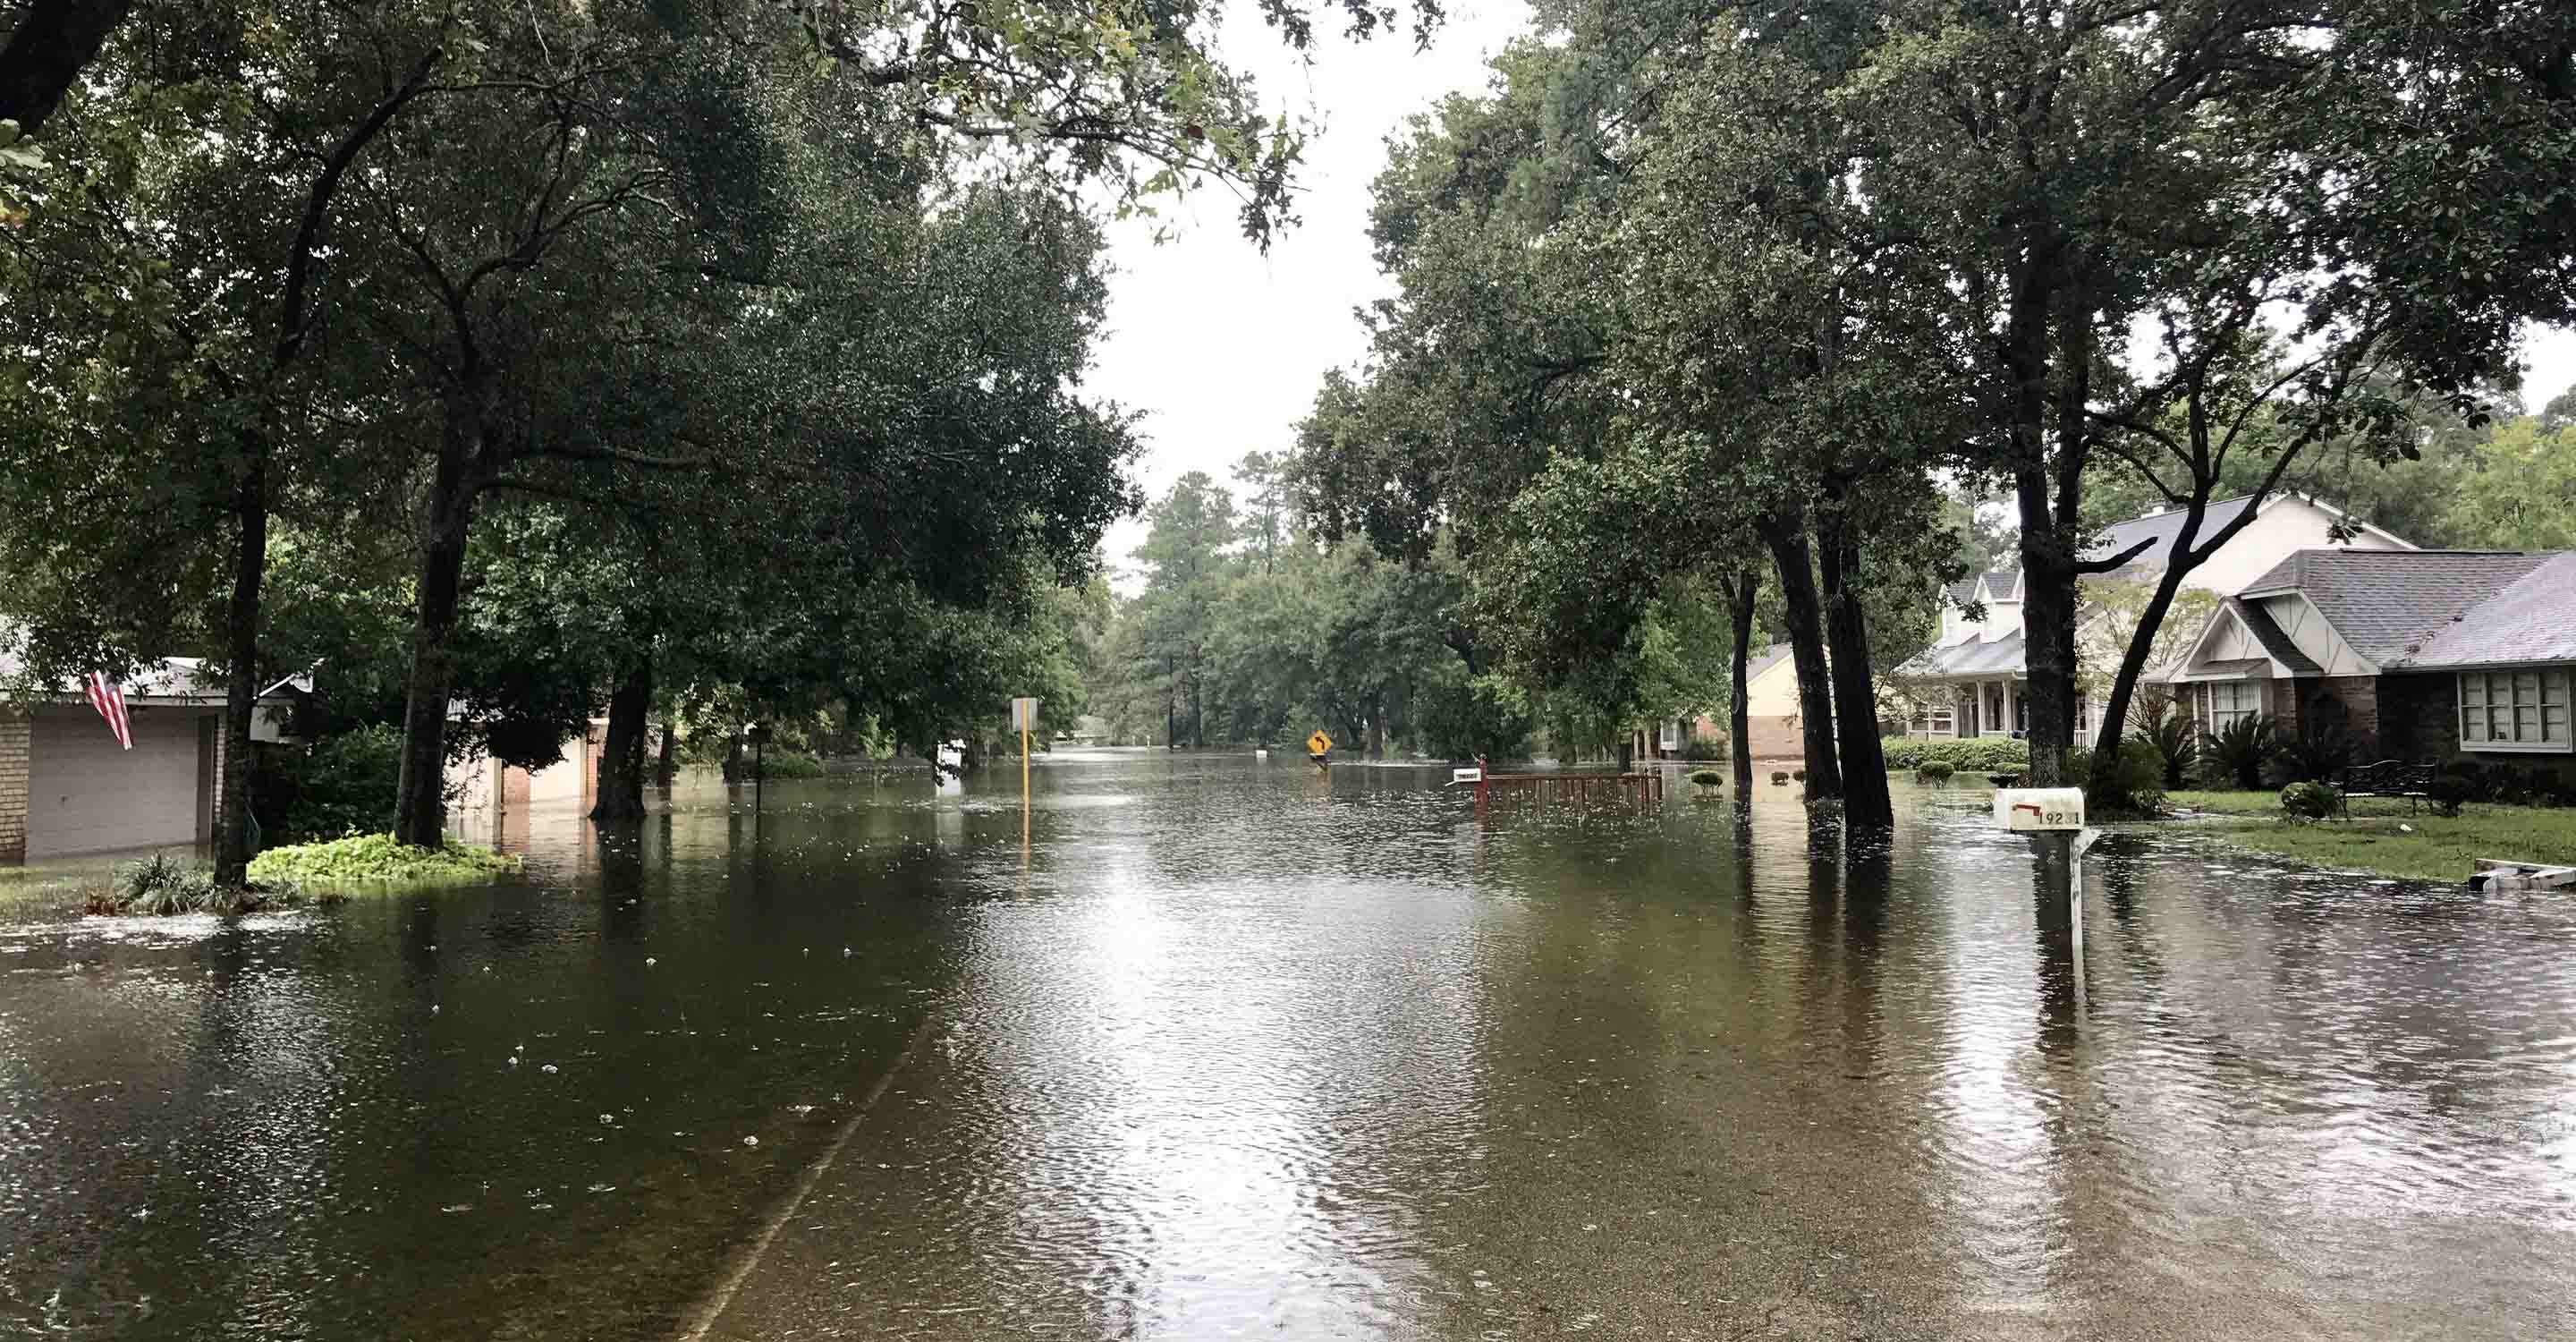
Nearly every Oregon city has a demonstrable fluctuation of PM2.5 levels based on the season. During the winter months, PM2.5 levels rise as households burn wood for domestic heating. Air quality in Oregon ranging from “moderate” to “unhealthy for sensitive groups” is common in most urban areas from November to February.
Oregon’s winter weather can further trap pollution emissions in the valleys between mountains as a result of a phenomenon described as “cool air inversions.” Cool air inversions occur when freezing ground level air is unable to escape into the atmosphere, as a result of a denser, warmer air layer above that acts like a lid. Without air being able to disperse, emissions accumulate and measured pollution levels rise. In Oregon, inversions typically occur in the winter when the ground is snow-covered and sunlight is less intense. Inversions tend to persist until weather changes with the seasons or with strong gusts of wind .
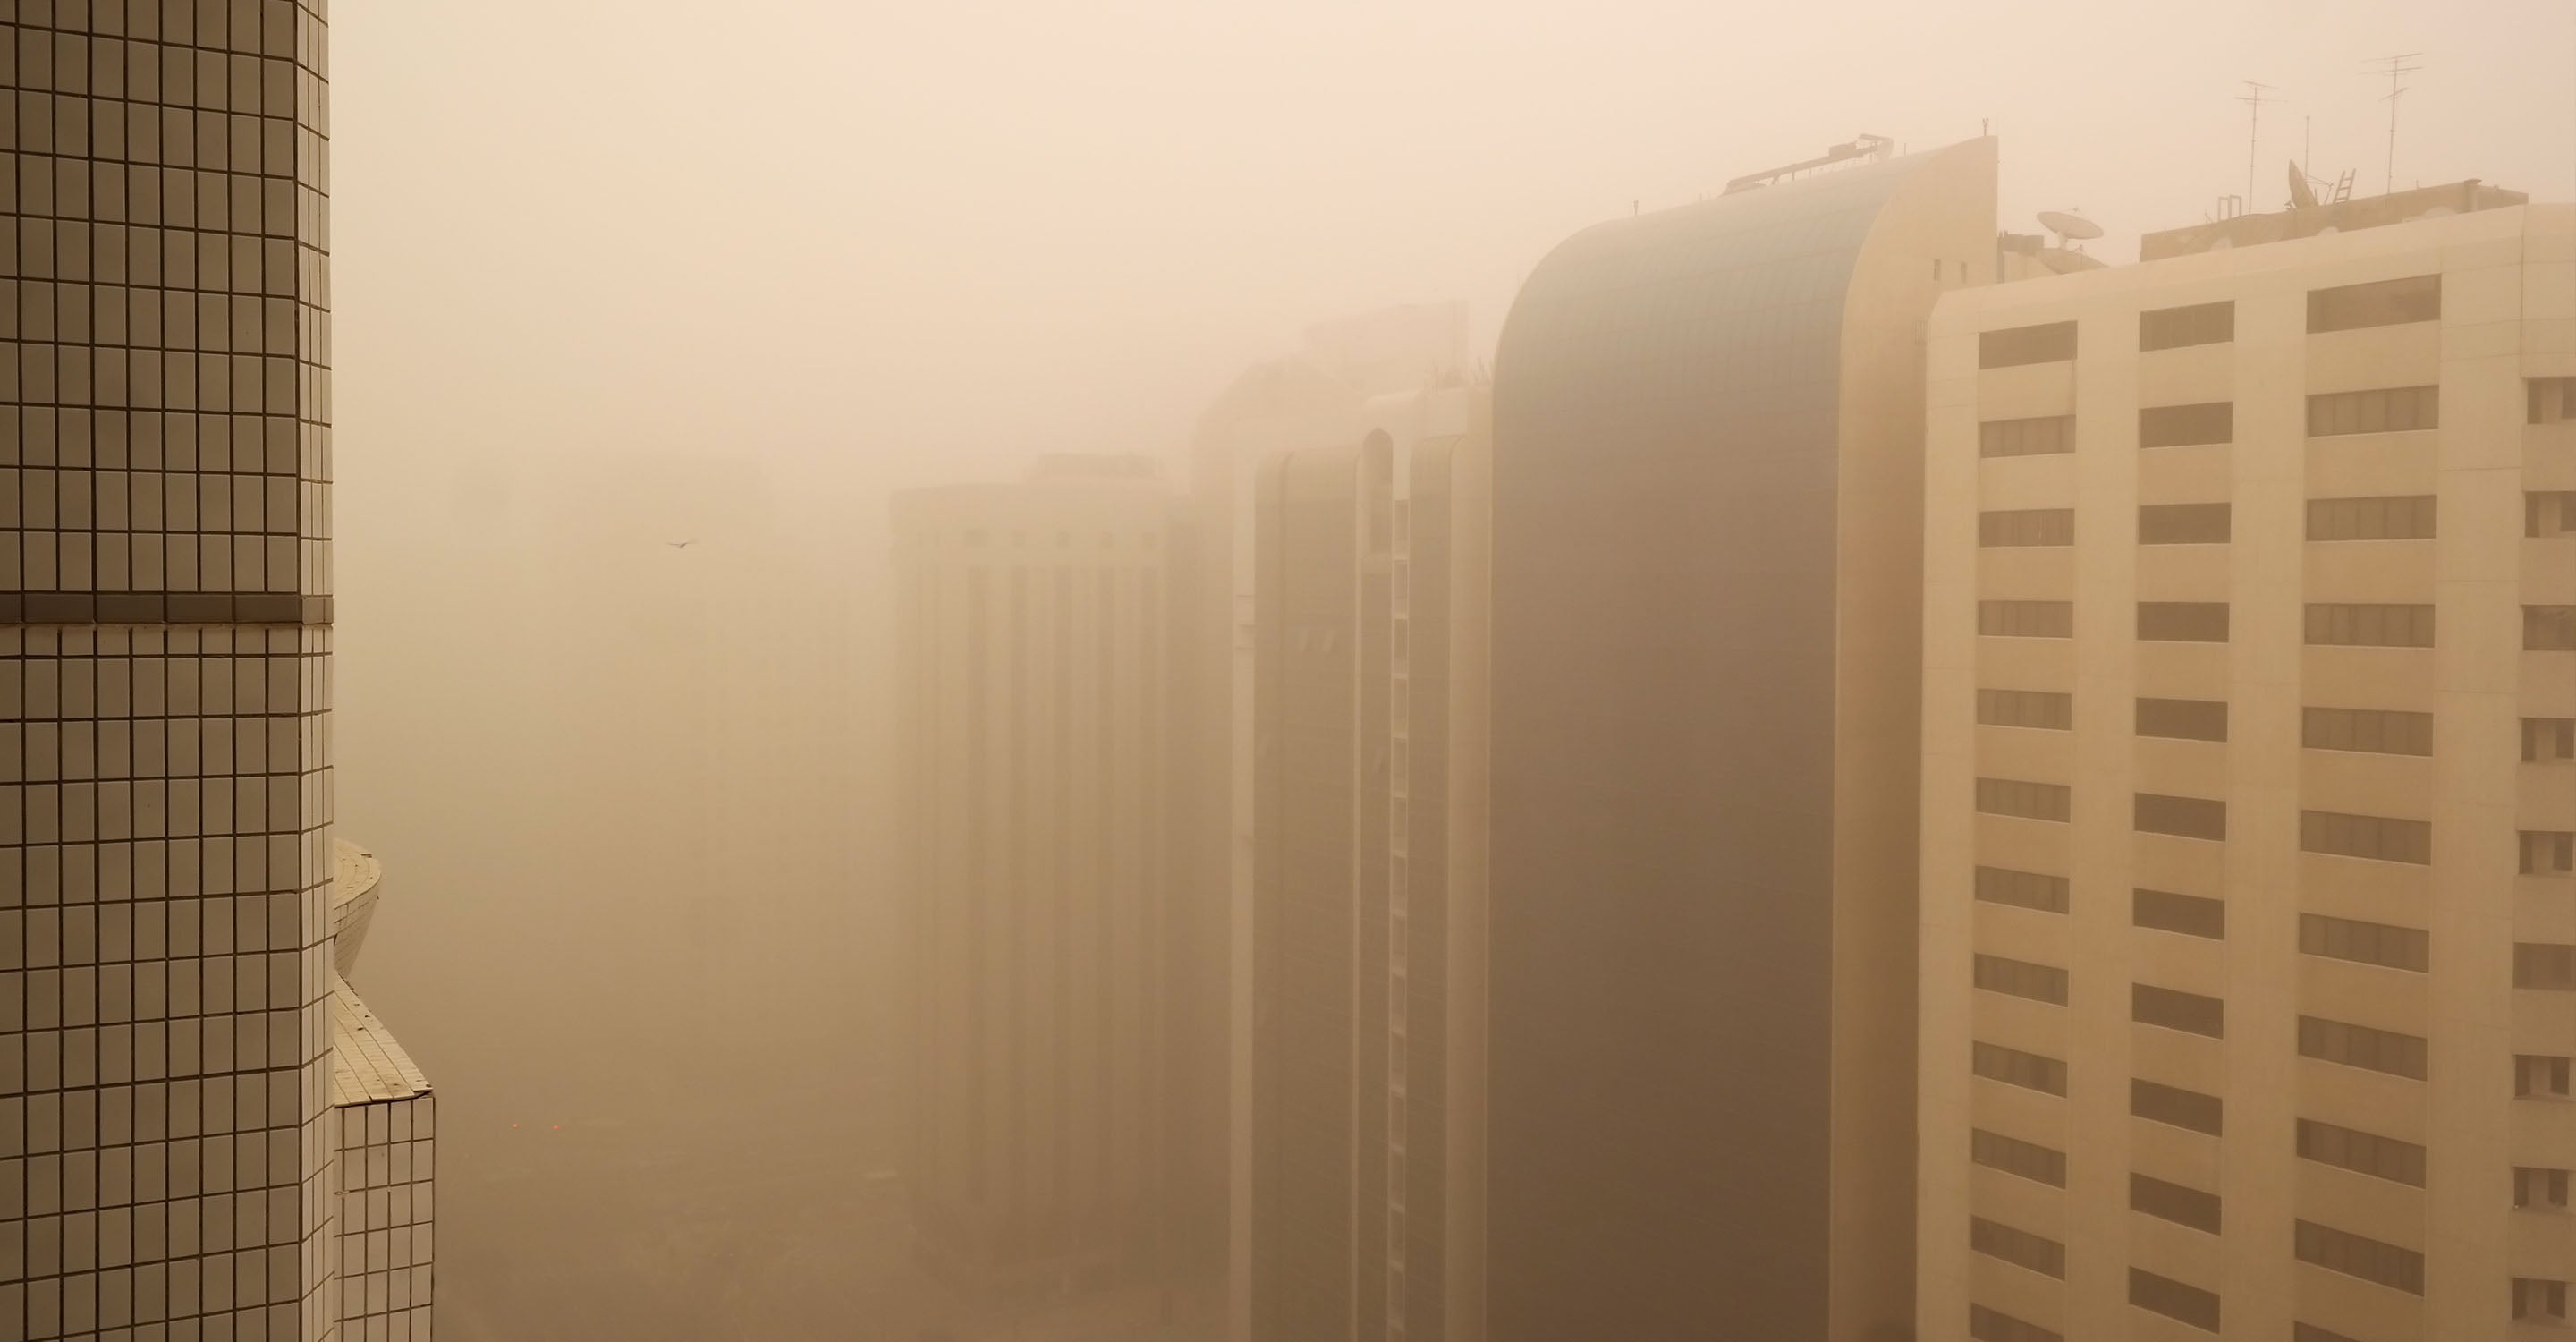
Wildfires present another major, and growing, source of PM2.5 that can give rise to exceptionally high levels, particularly in the late summer and early fall months. Oregon cities experienced higher all-around pollution levels in 2017 and 2018 (compared to 2019) as a result of severe wildfire seasons.
According to the 2020 “State of the Air” report published by the American Lung Association (ALA), which compares regional air quality across the US on the basis of short-term ozone, short-term PM2.5, and annual PM2.5, Oregon cities ranked for:1
On a city-by-city level, Oregon’s most polluted cities for PM2.5 pollution in 2019 were Aloha (13.9 μg/m3), Veneta (10.8 μg/m3), Canby (10.1 μg/m3), Cottage Grove (9.9 μg/m3), and Keizer (9.9 μg/m3). Each of these cities experienced heightened PM2.5 levels during the months of October through February as a result of winter wood burning and temperature inversions.
On the other end, Oregon’s cleanest air cities for PM2.5 pollution are Shady Cove (5.1 μg/m3), Birkenfeld (5.5 μg/m3), La Grande (5.6 μg/m3), Florence (5.6 μg/m3), and Sisters (5.7 μg/m3).
The live cities ranking on the left side of this page lists the locations that are currently experiencing the highest pollution levels in Oregon. Use this ranking to compare air pollution across Oregon in real time. For long-term trends, compare Oregon city data from 2019.
Regional wildfires have been the leading cause for “unhealthy” or worse air pollution in Oregon. While only serving as a temporary emission source, the impact of wildfires on daily and average PM2.5 measurements has been significant — and the problem appears to be getting worse.
Oregon’s smoky conditions have become increasingly common, as dry conditions and hot temperatures are on the rise.2 This, combined with other factors like an accumulation of forest undergrowth, steep mountains, and strong winds, has resulted in historic wildfires in recent years, notably in 2017 and 2020.
In 2020, Oregon broke records for the most acres burned in a single wildfire season.3 Similarly, several Oregon cities shattered records for unhealthy air pollution. Portland, Eugene, Bend, Medford and Klamath Falls all beat record pollution levels previously set by the 2017 wildfire season. Of those same 5 cities, only Medford had previously experienced air quality deemed “hazardous” since the Oregon Department of Environmental Quality (DEQ) began monitoring. In September of 2020, Eugene had six hazardous days, Bend and Medford had four, Portland had three, and Klamath Falls had two.
Use IQAir’s interactive air quality and fire tracking map to locate active fires, see the influence of wind on smoke direction, and understand how Oregon air quality is affected in real-time. Active fire data is sourced from NASA's Fire Information for Resource Management System (FIRMS) satellite observations, while air quality is modeled using measured data from ground-stations.
Oregon air quality has improved significantly since the 1970s when monitoring began. Around that time, Oregon’s largest city, Portland, was in violation of federal ozone standards by as much as 50 percent, while roughly a third of days exceeded carbon monoxide (CO) standards.4 Since then, a wave of emission controls on more than 170 industries and motor vehicles has greatly improved Oregon air quality. Portland hasn’t exceeded ozone or CO violations in decades.
More recently, several cities in Oregon, particularly Portland, have experienced rising PM2.5 and ozone levels that can be attributed to climate change and EPA regulatory rollbacks.
As temperatures rise, Oregon ozone levels are rising as well. Ozone is a secondary pollutant formed in the atmosphere when nitrogen oxides (NO2) and volatile organic compounds (VOCs) react in heat and sunlight. As temperatures warm, the ozone season is extended and ozone formation is accelerated.
As a highly reactive gas, breathing ozone attacks the lungs by reacting with the lung tissue. In the short term, ozone can cause breathing difficulty, coughing, chest pain, and shortness of breath. In the long term, ozone pollution can contribute to sustained health complications, and even early death.
In addition to increased ozone, warming temperatures can also lead to increased PM2.5 levels by lengthening the wildfire season and making fires more frequent and severe. In Oregon, 2017 and 2018 were more polluted on average than 2019 as a result of wildfires. 2020 is expected to top previous years as a result of record Oregon wildfires, despite COVID-19 lockdown measures taken earlier in the year that reduced vehicular traffic emissions.
A number of EPA regulatory rollbacks during the Trump administration are also expected to lead to elevated air pollution levels in Oregon in the long term. As of 2019, 16 air pollution and emission rollbacks have been finalized, with many more in progress.5 More than half of these directly target weakening governmental emission standards, oversight, and enforcement of polluting industries.
Moreover, as Oregon’s population continues to grow, so do emissions from traffic, construction, and wood stoves.
In order to combat a trend of rising emissions, action must be taken. Present opportunities for further reducing Oregon air quality levels include transitioning more residents to fuel-efficient, low-emission vehicles, increasing the share of renewable energy, further regulating winter wood burning, and using prescribed fires to reduce the risk of severe wildfires.
The majority of Oregon’s air pollution originates from motor vehicles, a common trend across US cities. Other sources include fossil fuel-based energy production, wood burning, construction, manufacturing, industry, and wildfires.
Of the motor vehicle category, diesel emissions comprise an unequal share. A 2010 study based in Portland and led by the DEQ found that roughly 65 percent of diesel emissions originate from non-road sources like heavy-duty machinery.6 When trains and commercial boats be included in this figure, the number rises to 73 percent. These non-road diesel emissions are largely from construction projects, an emission sector expected to grow in order to rebuild towns affected by wildfires and prepare for Oregon’s rising population.
Oregon air quality experiences strong seasonal variations in air pollution. Wood burning, more prominent in the winter, greatly contributes to Oregon’s winter emissions. The months of October through February often experience two times the measured pollution levels of the summer.
AQI levels in Oregon vary from city to city, as hyper local emission sources can have strong effects on an area’s air quality. Use Oregon’s air pollution map to understand the impact of local emission sources on state-wide air quality.
+ Article Resources
[1] American Lung Association. (2020). State of the air – 2020.
[2] Hill A. (2020, September 16). Why U.S. wildfires will only get worse. Council on Foreign Relations.
[3] KTVZ News Sources. (2020, September 15). Wildfire smoke has brought Oregon record-poor air quality, DEQ reports.
[4] Oregon Department of Environmental Quality. (2020). Air quality home.
[5] Popovich N, et al. (2019, December 21). 95 Environmental Rules Being Rolled Back Under Trump. The New York Times.
[6] Samayoa M. (2019, December 20). Nearly 2 dozen Oregon groups seek new pollution rules on toxic diesel emissions. OPB.
745Contributors
3 Government Contributors
67 stations
23 stations
3 stations
4 Non-profit organization Contributors
1 station
1 station
1 station

1 station
2 Educational Contributors
1 station
3 stations
Corporate Contributor

1 station
64 Individual Contributors

1 station

1 station
1 station
1 station

1 station

1 station
1 station

1 station
1 station
1 station
1 station
1 station
1 station

1 station
1 station
1 station

1 station

1 station
1 station
1 station
1 station
1 station

1 station
1 station

1 station
1 station

1 station

1 station
1 station
1 station
1 station
1 station
1 station

1 station

1 station
1 station

1 station
1 station
1 station
1 station
1 station

1 station
1 station

1 station
1 station
1 station

1 station

1 station
1 station

1 station
1 station
1 station
1 station

1 station

1 station
1 station
1 station
1 station
1 station

1 station
1 station
1 station

1 station
671 Anonymous Contributors

671 stations