Get a monitor and contributor to air quality data in your city.

123.7K people follow this city


AIR QUALITY DATA CONTRIBUTORS
147 Contributors


See all

| Index | Very high | ||
| Tree pollen | Very high | ||
| Grass pollen | Low | ||
| Weed pollen | None |

| Weather | Few clouds |
| Temperature | 60.8°F |
| Humidity | 31% |
| Wind | 15 mp/h |
| Pressure | 30 Hg |
| # | city | US AQI |
|---|---|---|
| 1 | Springville, California | 97 |
| 2 | Three Rivers, California | 83 |
| 3 | Fuquay-Varina, North Carolina | 68 |
| 4 | Raleigh, North Carolina | 66 |
| 5 | Chapel Hill, North Carolina | 65 |
| 6 | Cary, North Carolina | 64 |
| 7 | Greensboro, North Carolina | 64 |
| 8 | Anchorage, Alaska | 63 |
| 9 | Winston-Salem, North Carolina | 62 |
| 10 | Palm Desert, California | 61 |
(local time)
SEE WORLD AQI RANKING
| # | station | US AQI |
|---|---|---|
| 1 | N Columbia Way | 77 |
| 2 | Portland Near Road | 38 |
| 3 | Portland - SE Lafayette | 37 |
| 4 | North Blandena Street | 27 |
| 5 | Northeast 12th Avenue | 27 |
| 6 | Southwest Marigold Street | 27 |
| 7 | Hosford-Abernethy | 25 |
| 8 | Mojo Dojo Casa House | 25 |
| 9 | SW Westwood View | 24 |
| 10 | Southeast Portland 2 | 24 |
(local time)
SEE WORLD AQI RANKING
US AQI
20
live AQI index
Good

| Air pollution level | Air quality index | Main pollutant |
|---|---|---|
| Good | 20 US AQI | PM2.5 |
| Pollutants | Concentration | |
|---|---|---|
| PM2.5 | 4.8µg/m³ | |
PM2.5 concentration in Portland air currently meets the WHO annual air quality guideline value
 | Enjoy outdoor activities |
 | Open your windows to bring clean, fresh air indoors GET A MONITOR |
| Day | Pollution level | Weather | Temperature | Wind |
|---|---|---|---|---|
| Tuesday, Apr 16 | Good 20 AQI US | 62.6° 35.6° | ||
| Wednesday, Apr 17 | Good 23 AQI US | 68° 37.4° | ||
| Thursday, Apr 18 | Good 34 AQI US | 68° 42.8° | ||
| Today | Good 20 AQI US | 66.2° 42.8° | ||
| Saturday, Apr 20 | Good 8 AQI US | 57.2° 39.2° | ||
| Sunday, Apr 21 | Good 9 AQI US | 68° 37.4° | ||
| Monday, Apr 22 | Good 11 AQI US | 68° 46.4° | ||
| Tuesday, Apr 23 | Good 13 AQI US | 57.2° 44.6° | ||
| Wednesday, Apr 24 | Good 8 AQI US | 46.4° 41° | ||
| Thursday, Apr 25 | Good 5 AQI US | 57.2° 42.8° |
Interested in hourly forecast? Get the app
News
The latest air quality news and resources.
Portland air quality has achieved a mean annual air quality index (AQI) rating of “good.” For the last two decades, Portland has achieved air pollution standards set by the Environmental Protection Agency (EPA) for all six criteria pollutants measured in real-time: PM2.5, PM10, ozone, carbon monoxide (CO), nitrogen dioxide (NO2), and sulphur dioxide (SO2).
Despite this success, Portland’s air pollution levels have been climbing since 2016. The concerning trend coincides with a growing population and number of vehicles on the road, numerous EPA regulatory rollbacks, warming global temperatures, and more frequent and severe wildfires.
In the most recent 3-year monitoring period spanning 2016 to 2018, Portland averaged roughly 3 unhealthy pollution days a year.1 Due to the frequency of these events, the American Lung Association (ALA) graded Portland a “C” for 24-hour PM2.5 and 24-hour ozone in their 2019 State of the Air report. This is a slip from Portland’s “A” rating in the 2014 to 2016 monitoring period, which experienced less than 1 unhealthy day a year.
In Portland, each season brings unique pollution challenges. Fine particle pollution tends to rise in the winter months with increased household wood burning and pollution-trapping temperature inversions. Meanwhile, ozone, a secondary pollutant, only becomes problematic in the summer, when abundant sunshine and heat create ideal conditions for its formation.
Monitor Portland air pollution data at the top of this page to stay aware of pollution spikes and health advisories. The “main pollutant” indicates which of the six criteria pollutants is present at the riskiest levels (usually PM2.5 or ozone). When Portland PM2.5 levels are exceedingly high, there is usually a fire burning nearby or domestic wood burning during a cool air inversion. Ozone tends to indicate warmer temperatures and increased vehicular traffic, such as during rush hour, though individual sources may vary.
Portland’s unhealthy air pollution is a combination of PM2.5 and ozone pollution, two of the most prevalent and dangerous pollutants in the US. While both pollutants share some of the same sources, such as motor vehicles and fossil fuel combustion at industrial complexes, power plants, and factories, they are also unique.
Ozone, a secondary pollutant, occurs in the atmosphere when high temperatures (over 84°F) and sunlight (UV radiation) causes pollutants, nitrogen oxides (NOx), and volatile organic compounds (VOCs) to react. Precursor pollutants are largely emitted by vehicles and smoke stacks; however, they can also travel hundreds of miles from neighboring cities when carried by wind. Portland, for example, can be adversely affected by Seattle air quality, Bend air quality, or Eugene air quality.
Portland’s ozone season runs from May through September, when the city experiences an average of 51 days over 80 degrees.2 As temperatures continue to rise as a result of climate change, it will be increasingly difficult to manage ozone levels. Limiting the emissions of pollution sources, such as switching to cleaner energy, transitioning to electric vehicles, and cooperating with regional towns and cities, offer an opportunity for reducing ozone despite warming temperatures creating more ideal conditions for its formation.
Portland’s PM2.5 pollution tends to be attributable to vehicular emissions, wildfires in the late summer and early fall, and domestic wood burning in the winter months.
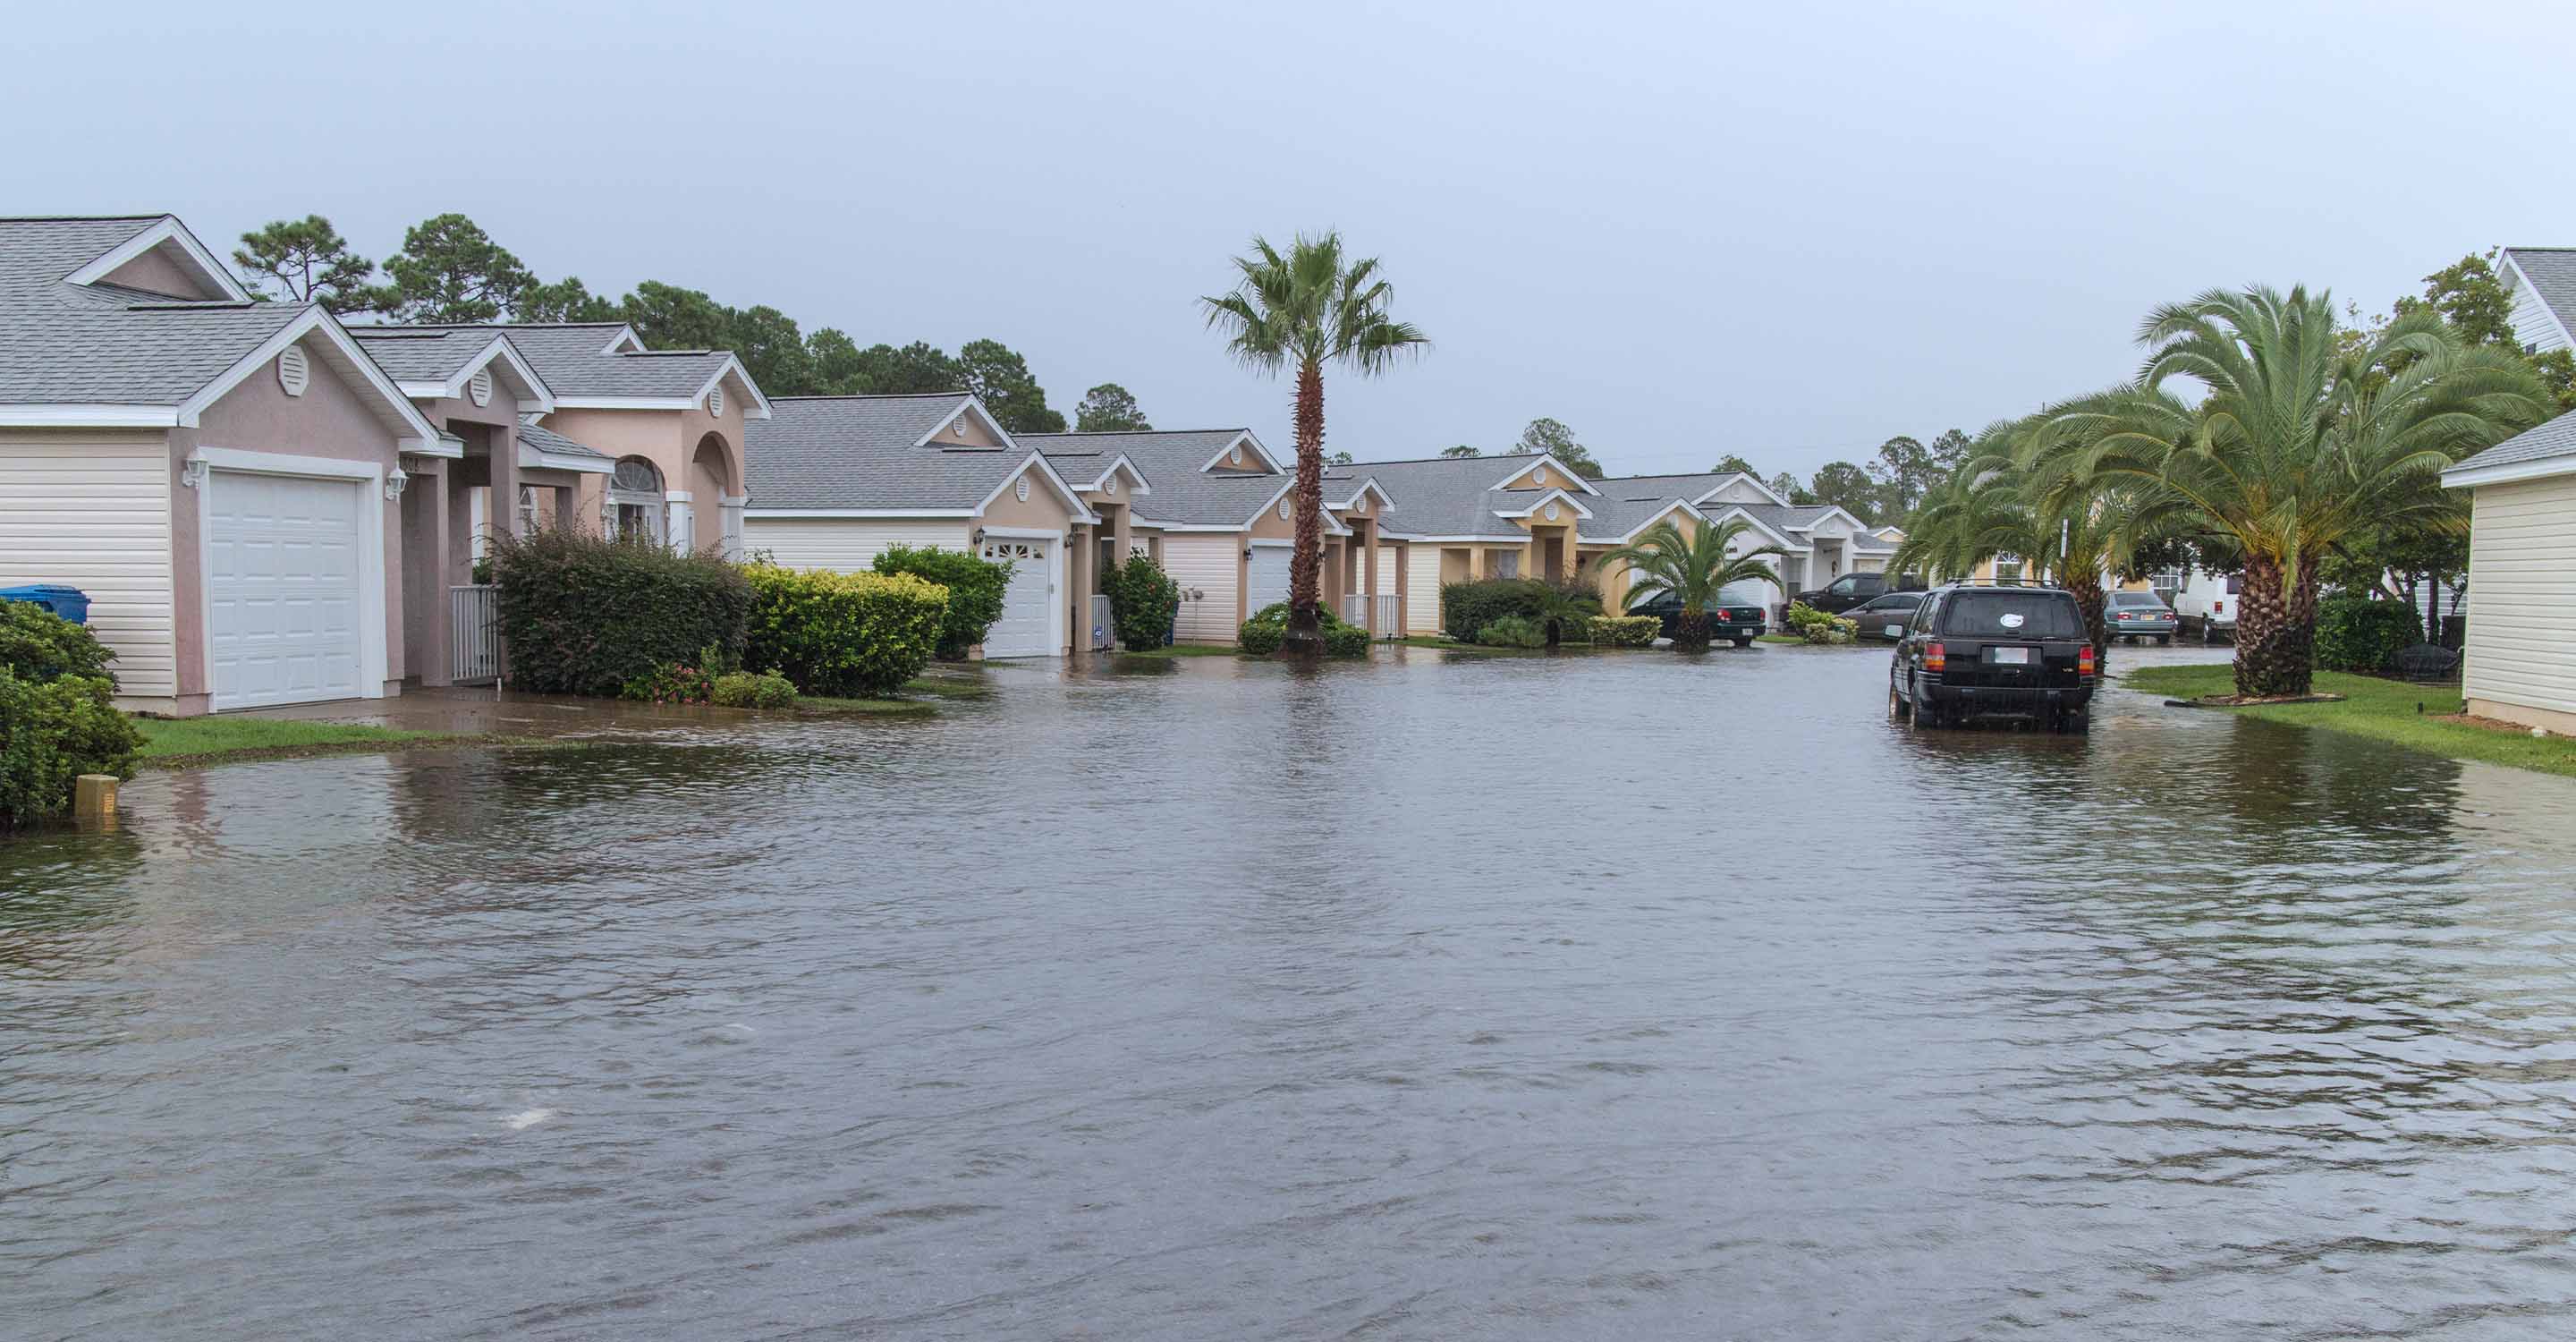
The Mosier Creek Fire, which burned east of Hood River in the town of Mosier in August 2020, is an example of a wildfire that caused “unhealthy” PM2.5 pollution levels in Portland.3
More often, PM2.5 spikes are the result of domestic wood burning and cool air inversions in the winter. This is the case for Portland’s most polluted months in November and December. Cool air inversions, or temperature inversions, occur when warm air caps colder air below, preventing the normal dispersion of air pollution in the atmosphere. Snow cover and sparse light contribute to these conditions, creating freezing cold surface air. Cool air inversions persist, accumulating surface-level air pollution until temperature and weather change allow sunlight to warm the surface air more than the air above.
Portland has made significant gains in improving air quality over the last two decades. The progress has been the result of a combination of regulations on a local, state, and federal level which have increasingly shifted to cleaner and more efficient uses of energy, and emission limits. There is still more to be done.
In 2019, Portland’s most polluted months were November and December (respectively), with PM2.5 concentrations of 18.4 μg/m3 and 17.1 μg/m3 (three times the average PM2.5 concentration of summer months). Particle pollution spikes during these months have caused Portland to rank among the top 25 cities with the most short-term particulate pollution, according to the ALA’s 2019 report.
High PM2.5 levels during these months are the result of domestic woodburning and temperature inversions, which create a pollution-trapping effect. These seasonal particle pollution fluctuations cause Portland to average more PM2.5 pollution than New York City, the most populous metropolitan area in the US (which experiences an annual average of 7 μg/m3).
A Multnomah County ordinance passed in January 2018 seeks to reduce the impact of wood burning in the winter by enforcing a ban based on Portland’s live air quality conditions. Wood burning is limited to times of “green” or “good” US AQI levels.4 Exceptions have been made, however, for those with permits, or if wood burning is for cooking, heat, and light during a power outage, or otherwise serves as a household's only source of heat.
Ozone and PM2.5 pollution contribute equally to Portland air pollution, with 1.5 unhealthy pollution days attributed to ozone and 1.3 unhealthy pollution days attributed to PM2.5 pollution. Improvements to Portland air quality must therefore strive to manage both PM2.5 and ozone precursors.
Emissions from motor vehicles are a leading source of both ozone and particle pollution (PM2.5) in Portland. Targeting emission reductions here can reduce prevalence of both pollutants.
During the 2020 COVID-19 pandemic, lockdown measures shuttered non-essential businesses and greatly reduced non-essential travel. In doing so, Portland had a rare glimpse into the impact reduced traffic emissions could have on the city’s air quality. A study conducted by the Oregon Department of Environmental Quality found that COVID-19 restrictions led to 40 percent less traffic on the I-5, a 60 percent drop in nitrogen oxides( an ozone precursor pollutant), and a 25 percent drop in black carbon (PM2.5 soot).5
Sustaining these reductions in the long term is likely possible by shifting at least half of currently registered motor vehicles to electric vehicles or other hybrid low emission alternatives. The State of Oregon currently seeks to add 3.3 million zero emission vehicles by 2025 and hopes that all vehicles will be zero-emission by 2050.6 Such changes will result in drastic improvements to Portland’s air quality.
Air pollution in Portland comes from a range of sources, including a combination of mobile sources (motor vehicles), stationary sources (smoke stacks from power plants and factories), and area sources (agricultural areas and wood burning fireplaces).
In much of the US, mobile sources represent the largest single emission source. This emission source is particularly culpable for Portland’s ozone challenges.
Stationary emission sources in Portland include Portland General Electric, Oregon’s only coal-fired power plant, pulp and paper mills, and natural gas-fired plants.7 Most of Portland’s stationary emission sources are concentrated on the northern end of the city.
Racist redlining practices dating back to the 1930s have had a lasting impact on Portland’s neighborhood demographics and the distribution of air pollution in the city. High-polluting city features such as airports, major roadways, factories, industrial complexes, and power plants have historically been placed near these disadvantaged communities, further driving down the value of the homes in these neighborhoods while also burdening them with higher amounts of air pollution.
A study led by Portland State University found that 42 percent of historically redlined neighborhoods are less than 1 mile from the city’s top 10 polluters.8 As a result of the lingering impact of redlining, 38 percent of Portland’s non-white residents live in a 2-mile radius of these emission sources. Not only do these communities bear a disproportionate amount of air pollution, they also suffer more adverse and acute health effects as a result.
Non-white Americans who have historically occupied lower-income neighborhooods have 50 percent higher infant mortality and low birth weights than whites as well as higher rates of diabetes, high blood pressure, physical disabilities, stroke, diabetes, heart disease, and cancer deaths. These negative effects, brought on in part by commercial and government operations, must be addressed as an environmental justice issue. All communities deserve the right to healthy, clean air.
+ Article Resources
[1] American Lung Association. (2020). State of the air – 2020.
[2] Current Results. (2020). Portland temperatures: Averages by month.
[3] Raineri J. (2020, August 13). Air quality advisory in place for parts of the Gorge from Mosier Creek Fire. KGW.
[4] Multnomah County Environmental Health Services. (2020). Winter wood burning restrictions.
[5] Williams K. (2020, May 1). Amid the coronavirus shutdown, some types of air pollution down by as much as 60 percent in Portland. The Oregonian/OregonLive.
[6] City of Portland Oregon. (2020). ENN-5.06 - Portland 2017 Electric Vehicle Strategy.
[7] Learn S. (2019, January 10). Power plants Oregon's largest single sources of global warming emissions, new EPA inventory shows. The Oregonian.
[8] Profita C. (2020, April 29). Study: More people of color live near Portland’s biggest air polluters. Oregon Public Broadcasting (OPB).
147Contributors
Government Contributor
10 stations
Non-profit organization Contributor
1 station
2 Educational Contributors
1 station
1 station
9 Individual Contributors
1 station
1 station
1 station
1 station

1 station
1 station
1 station

1 station
134 Anonymous Contributors
134 stations
4 Data sources
 Data validated and calibrated by IQAir