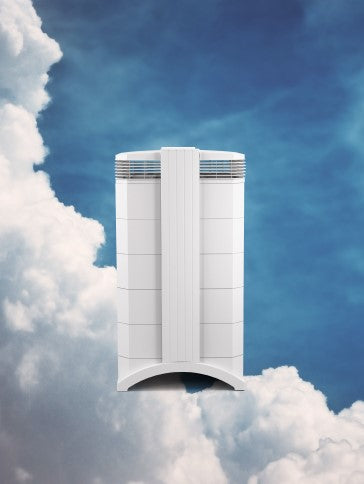
Get a monitor and contributor to air quality data in your city.

15K people follow this city


AIR QUALITY DATA CONTRIBUTORS
Luftkvalitet.info - Norwegian Institute for Air Research
See all

| Index | Very high | ||
| Tree pollen | Very high | ||
| Grass pollen | None | ||
| Weed pollen | None |

| Weather | Broken clouds |
| Temperature | 42.8°F |
| Humidity | 100% |
| Wind | 3.4 mp/h |
| Pressure | 30.2 Hg |
| # | city | US AQI |
|---|---|---|
| 1 |  Bergen, Hordaland Bergen, Hordaland | 38 |
| 2 | Sjolyststranda, Oslo | 34 |
| 3 | Oslo, Oslo | 25 |
| 4 | Stavanger, Rogaland | 22 |
| 5 | Lillehammer, Oppland | 21 |
| 6 | Trondheim, Sor-Trondelag | 16 |
| 7 | Drammen, Buskerud | 9 |
(local time)
SEE WORLD AQI RANKING
| # | station | US AQI |
|---|---|---|
| 1 | Rådal | 41 |
| 2 | Danmarks plass | 38 |
| 3 | Klosterhaugen | 38 |
| 4 | Loddefjord | 35 |
| 5 | Rolland, Åsane | 30 |
(local time)
SEE WORLD AQI RANKING
US AQI
38
live AQI index
Good

| Air pollution level | Air quality index | Main pollutant |
|---|---|---|
| Good | 38 US AQI | PM2.5 |
| Pollutants | Concentration | |
|---|---|---|
| PM2.5 | 6.8µg/m³ | |
| PM10 | 13.9µg/m³ | |
| O3 | 74.1µg/m³ | |
| NO2 | 4.5µg/m³ | |
PM2.5
x1.4
PM2.5 concentration in Bergen is currently 1.4 times the WHO annual air quality guideline value
 | Enjoy outdoor activities |
 | Open your windows to bring clean, fresh air indoors GET A MONITOR |
| Day | Pollution level | Weather | Temperature | Wind |
|---|---|---|---|---|
| Tuesday, May 7 | Good 32 AQI US | 51.8° 48.2° | ||
| Wednesday, May 8 | Good 32 AQI US | 50° 46.4° | ||
| Thursday, May 9 | Good 34 AQI US | 48.2° 44.6° | ||
| Thursday, May 9 | Good 37 AQI US | 48.2° 44.6° | ||
| Today | Good 38 AQI US | 48.2° 42.8° | ||
| Saturday, May 11 | Good 34 AQI US | 55.4° 44.6° | ||
| Sunday, May 12 | Good 40 AQI US | 57.2° 50° | ||
| Monday, May 13 | Good 30 AQI US | 60.8° 51.8° | ||
| Tuesday, May 14 | Good 17 AQI US | 62.6° 51.8° | ||
| Wednesday, May 15 | Good 28 AQI US | 66.2° 53.6° | ||
| Thursday, May 16 | Good 20 AQI US | 60.8° 50° |
Interested in hourly forecast? Get the app
News
The latest air quality news and resources.
Bergen is the second-largest city in Norway, the largest being the capital, Oslo. The municipality covers an area of 465 square kilometres and is home to 283,929 people.
The air quality index for 2019 revealed that Bergen enjoyed relatively good quality air as it achieved the target figure as recommended by the World Health Organisation (WHO). This figure is less than 10 µg/m³, or microns per cubic metre. The WHO target was attained for 10 months of the year with just the months of April and November exceeding the level with figures of 10.4 and 10.3 µg/m³. These figures are still classed as “Good”, though.
The main pollutant in Bergen is first and foremost carbon dioxide (NO2) where the main source is traffic and transportation and airborne dust where the main source is wood-burning stoves in private households.
Road dust PM2.5 and PM10 consists mostly of mineral particles that are formed by the wear of the stone material in the road surface by brake pads and from studded tyres. The health effects of these particles are particularly linked to more frequent and worsening respiratory problems.
The air quality criterion for nitrogen dioxide (NO2) is set at 40 µg/m³ as an annual average. The air quality criteria are set so low that most people can be exposed to these levels without any harmful effects on their health. In Bergen, the annual average of nitrogen dioxide (NO2) is usually around 40 µg/m³. This means that nitrogen dioxide levels measured in Bergen in recent years, for most people, are not harmful to health.
Exposure to airborne dust can lead to inflammatory responses, which seems to be central to the development and exacerbation of cardiovascular disease. Recent studies also suggest that airborne dust may cause effects on the nervous system, on foetal development, as well as aggravate or cause metabolic disorders such as diabetes and obesity. The most sensitive groups for these health effects are lung patients including asthmatics and COPD patients, as well as those suffering from cardiovascular disease. Children, including foetuses and the elderly, are also considered sensitive to airborne dust exposure (PM2.5 and PM10).
The Climate and Environmental Research Institute Nansen Centre has now carried out a study that estimates how wood-burning in private homes contributes to airborne dust up to five meters above the ground in the city.
The model simulations indicate that between 4,000 and 6,000 properties in Bergen are exposed to high air pollution from particulate matter as a direct result of wood burning on cold winter days with inversion. In addition, wood-burning causes moderate air pollution in about 18,000 properties. Particulate matter from wood-burning thus has negative consequences for up to 24,000 properties.
The researchers have then made calculations of what happens if all the old fireplaces and stoves are replaced with new ones which cause far less pollution than the older ones. Then emissions from private wood burning in Bergen would be reduced by 64 per cent. No properties will be exposed to high air pollution from airborne dust from wood-burning, and only 1,000-2,000 properties would receive moderate air pollution for the same reason. If all old wood stoves and fireplaces are replaced with new stoves, almost no one in Bergen will be exposed to harmful airborne dust from wood-burning. But the researchers emphasise that this study concerns the effect of wood burning, not other air pollution.
In 2017, Bergen municipality granted NOK 50 million for a support scheme where up to 10,000 homeowners receive NOK 5,000 in "wreck mortgages" on stoves and fireplaces that were installed before 1998.
All healthy people experience irritation symptoms when they are exposed to high levels of pollution where they live or stay. Such ailments are unpleasant but not dangerous but that depends on pre-existing conditions or not.
The Norwegian Agency for Health Services recommends that all residents assess their outdoor activity in areas with high air pollution. They can do this via their website using a colour-coding system.
When the colour is green, there is very little risk from air pollution as the air is relatively clean.
The colour orange represents moderate pollution where health effects may occur in some asthmatics and people with other respiratory diseases, as well as people with severe cardiovascular disease. Outdoor activity can be recommended, but allergy sufferers, asthmatics and others with respiratory disorders (COPD, bronchitis, pneumonia, etc.) should consider their activity in areas with heavy traffic or high other emissions.
Red indicates a level of high pollution with significant health risks. Health effects can occur in asthmatics and people with other respiratory diseases, as well as people with severe cardiovascular disease. Children with respiratory disorders (asthma and bronchitis) and adults with severe cardiovascular or respiratory disorders should reduce outdoor activity and avoid the most polluted areas. Staying outdoors at the busiest hubs such as Danmarks plass, the bus terminal in Loddefjord and at Lagunen in Rådal for a slightly longer period (more than 1 hour), can cause irritation to the mucous membranes and airways. Sometimes a skin rash can develop depending on the chemical content of the air.
Purple represents the highest, most dangerous level of air pollution. Sensitive groups in the population can have serious health effects. Respiratory tract irritation and discomfort may occur in healthy people.
Those who have cardiovascular disease, COPD or asthma, have an increased risk of severe worsening of their condition. Allergy sufferers may experience more severe symptoms from the respiratory tract. In general, the population should consider their outdoor activity in areas with very high air pollution.
The main health effects associated with nitrogen dioxide (NO2) exposure are impaired lung function and worsening of asthma and bronchitis. Population studies also show an association between carbon dioxide exposure and mortality. These health effects can be observed with both short and long term exposure. Asthmatics and allergy sufferers are among the most sensitive groups. COPD patients and people with chronic bronchitis are also sensitive to carbon dioxide exposure.
1Contributor
Government Contributor